
Powerful metrics
track your results

Five key metrics
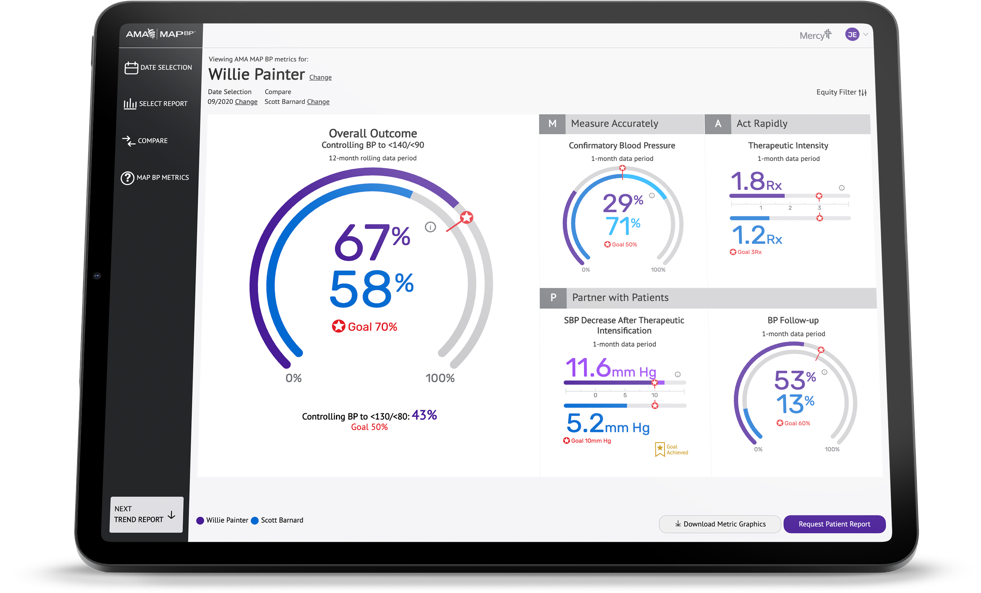
As part of AMA MAP Hypertension™, physicians and clinics have access to a dashboard that provides monthly reports and tracking data on process and outcome metrics.

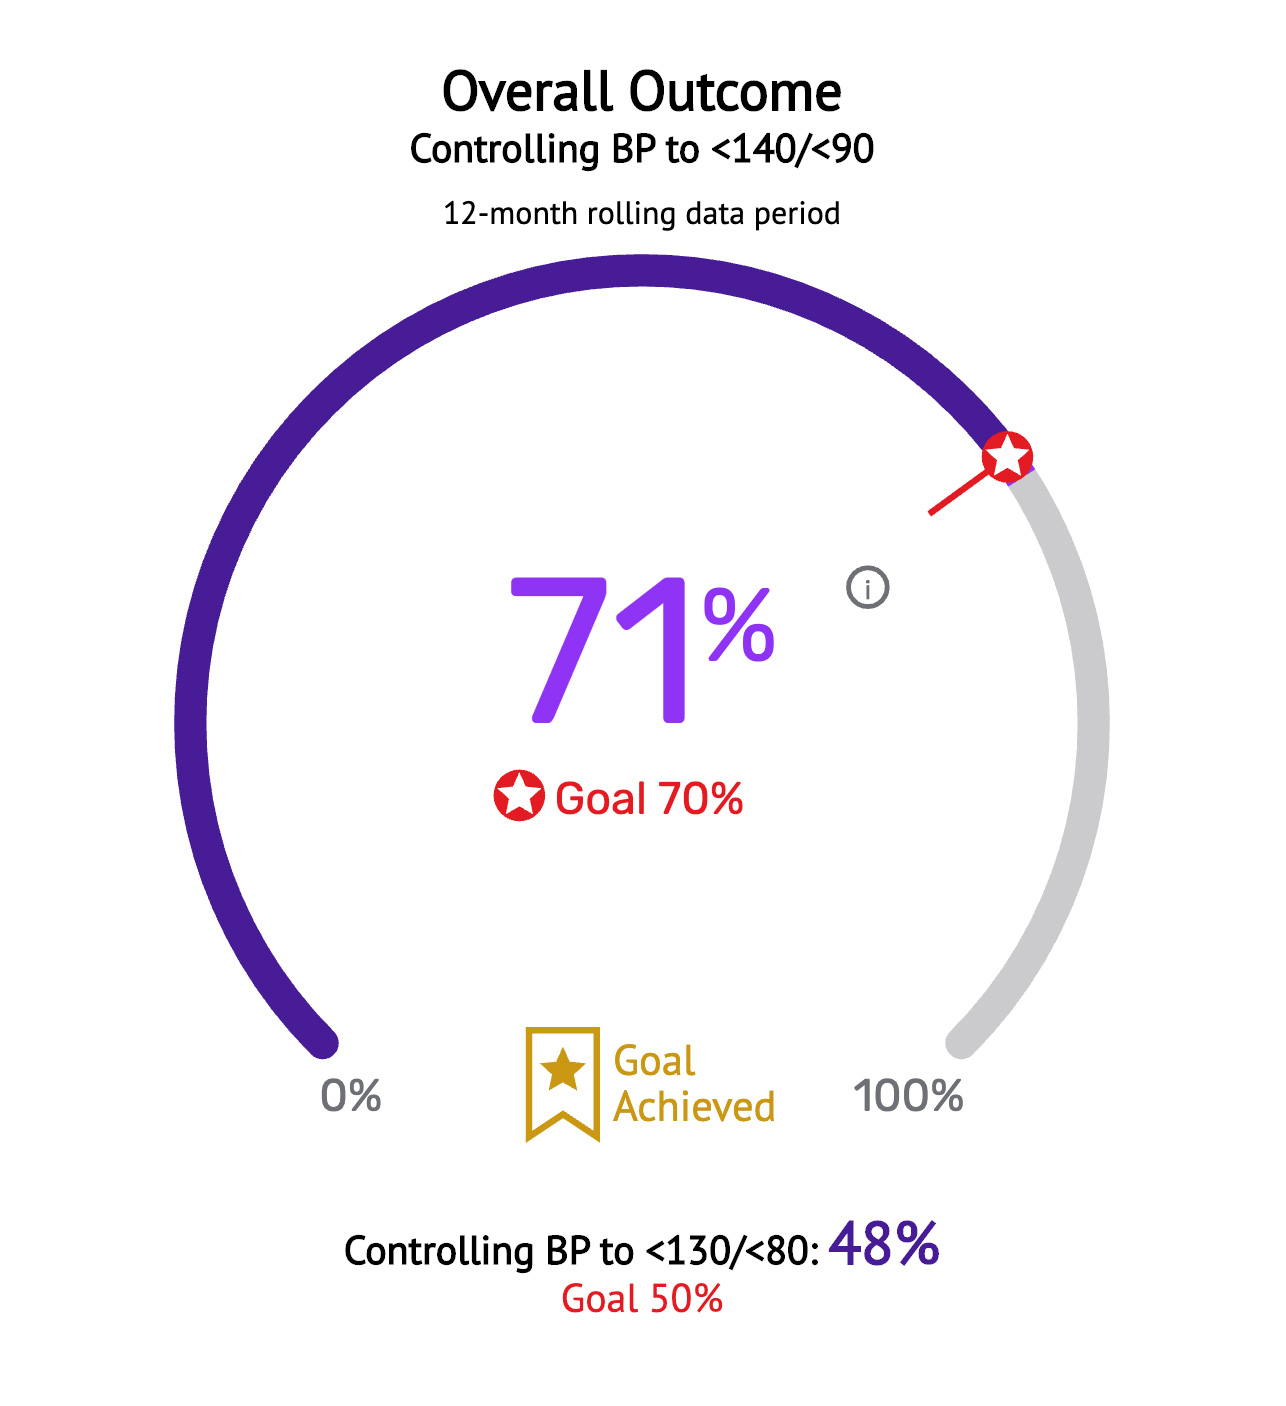
Overall Outcome
Percentage of patients 18 through 85 years of age who had a diagnosis of hypertension and whose BP was adequately controlled during the most recent encounter of the measurement period.


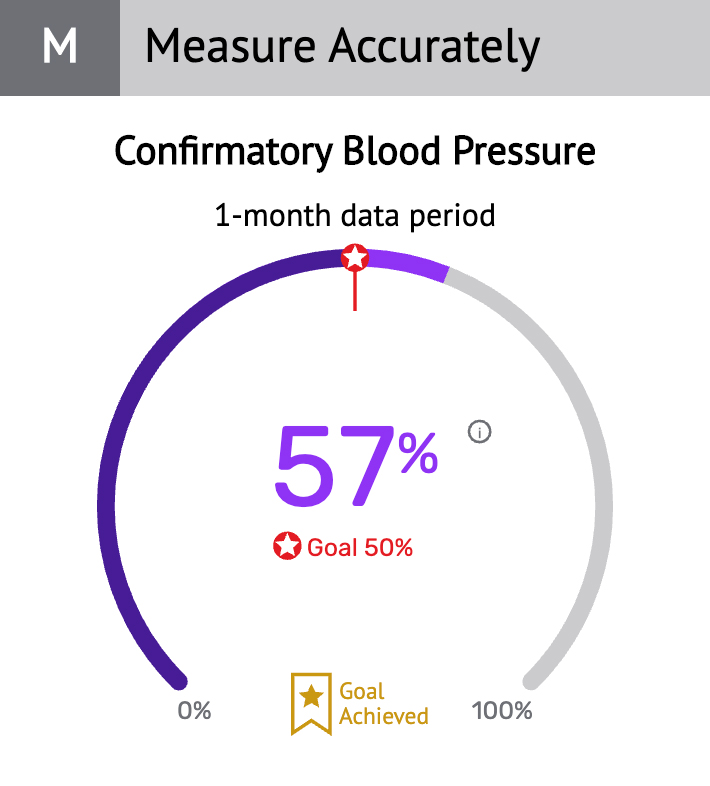
Confirmatory Blood Pressure
Percentage of patients with an initial high BP confirmed by a repeated measurement during the encounter.

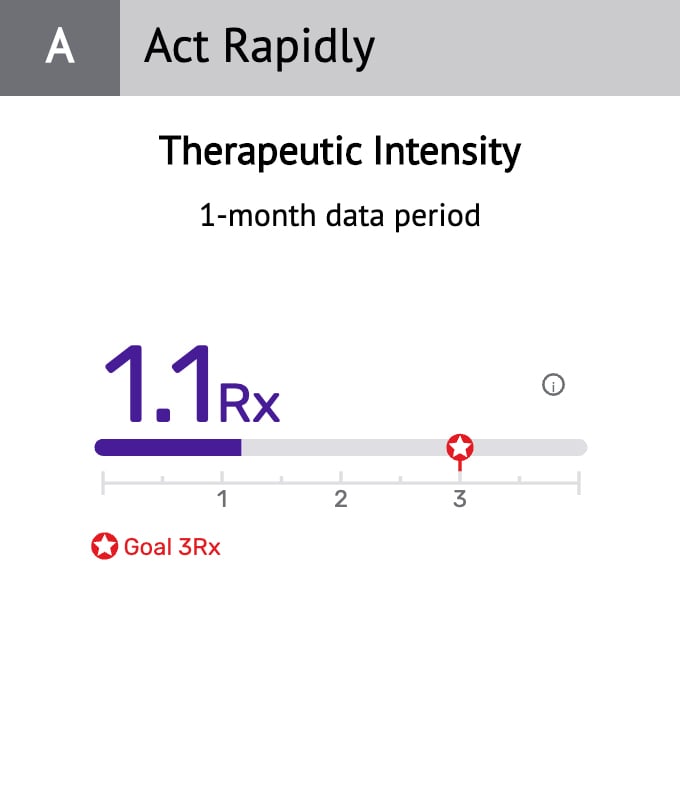
Therapeutic Intensification
Percentage of adults with uncontrolled HTN at a visit during which as antihypertension medication class is added

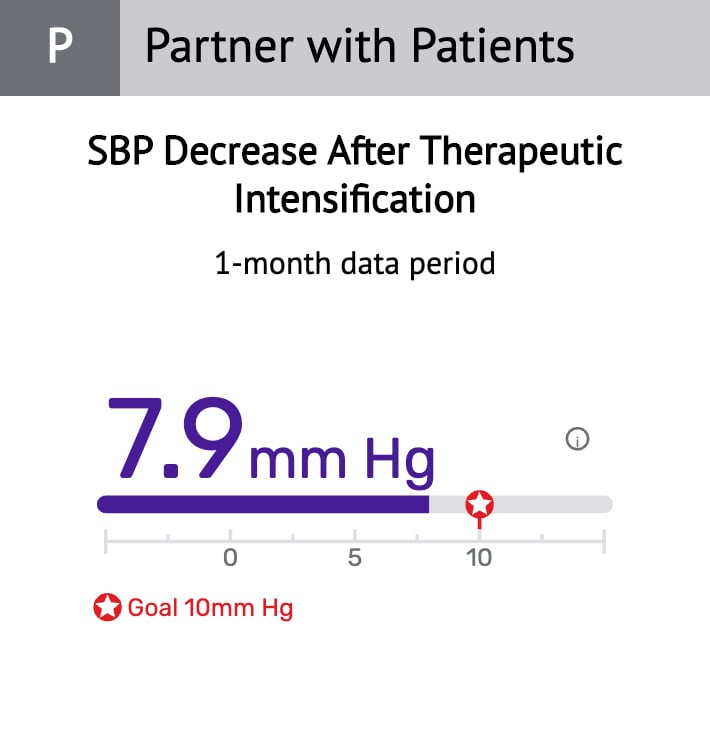
SBP Change After Therapeutic Intensification
Percentage of adults with HTN who have a ³10 mmHg fall in SBP after an antihypertension medication is added to treat uncontrolled BP

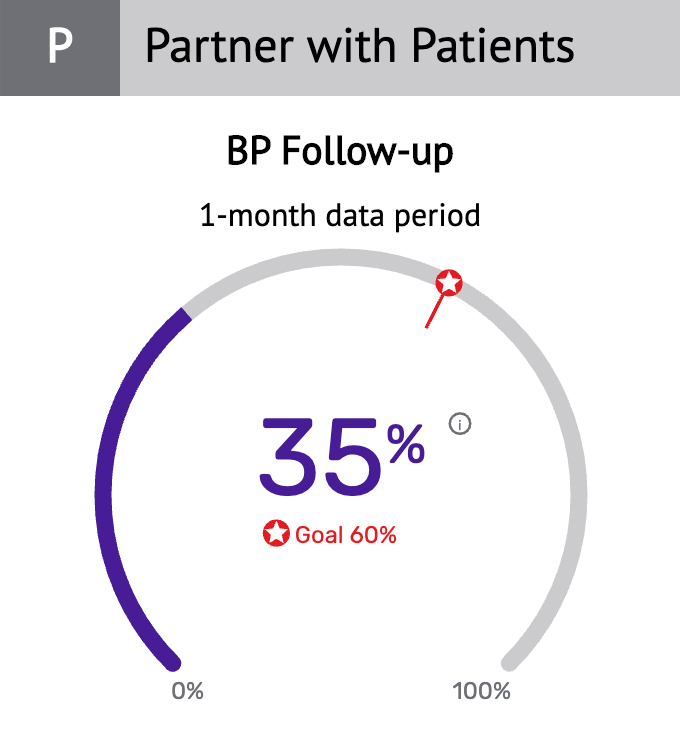
Visit Follow-up
Percentage of patients with an uncontrolled BP in the previous month having a follow-up BP measurement within 30 days.
Explore results with flexible data tools
The AMA MAP Hypertension Dashboard allows your organization to access and review data in depth, ensuring your care
team has access to the most relevant patient data.
Equity Filter
Filter data by gender, race, ethnicity and age.
Date selection
Refine your data by either 12-month rolling or single-month periods.
Report selection
Take a closer look at your data by organization, site, groups, clinicians and more.
Comparisons
See how your progress compares to others in your HCO.
Trends
See changes month over month as well as 12-month rolling overall progress.
Reporting
Create and download secure, detailed reports of your dashboard data for use offline.

Ready to put your HCO on the map?
Get in touch today
Let us know you're interested in learning more about AMA MAP BP. We'll connect with you and help determine if this program is right for your organization.
Get Started